Published on July 24th, 2026
The majority of patients seeking treatment often rely on word of mouth, advertisements, and proximity to make a choice. But selecting the right hospital has never been more important, especially if you want to stay safe.
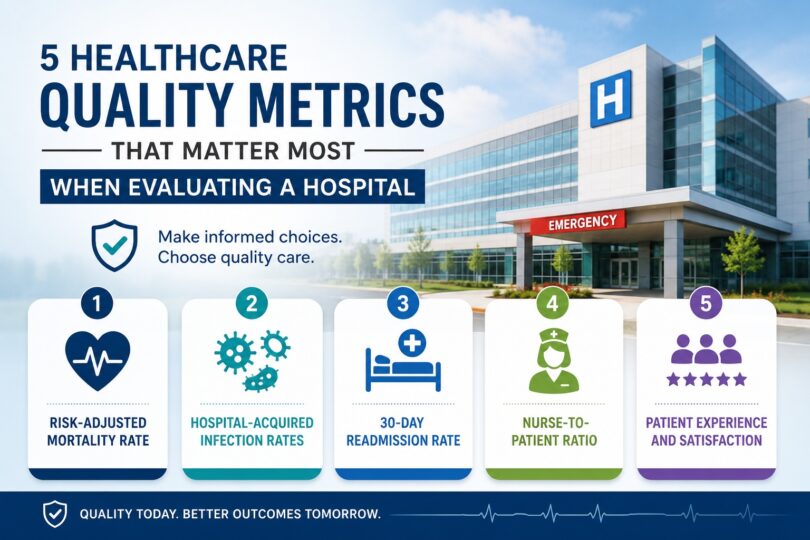
Here are five statistics you should check before making up your mind.
The framework behind hospital quality measurement
Before we delve into the specifics of metrics, it’s helpful to understand how we think about quality in the first place.
The Donabedian Quality Model, named for the physician who developed it, Avedis Donabedian, breaks quality down into three categories: structure, process, and outcomes.
Structure is about the physical and organizational characteristics of a hospital – such as staffing, technology, and design.
Process is what clinicians do when they care for patients – like following a particular protocol, reconciling a patient’s medications, or completing a pre-surgical checklist. Outcomes are the results that follow – like survival, complications, and recovery.
This is an important concept because it guides where you should focus your attention when assessing a hospital. A beautiful new building is a structural characteristic, but in a beautiful building with no intensivist on overnight at 2 a.m., there is a structural gap that impacts patient safety.
Understanding all three aspects helps prevent you from being unduly influenced by superficial characteristics that aren’t actually impacting the quality of care being delivered.
1. Risk-adjusted mortality rate
The concept of a number of deaths is easy to understand, but the number of patients who died at this hospital doesn’t provide enough information and in some situations it is even inappropriate.
While hospital mortality uses the best data available to us about how a hospital is doing in terms of patient deaths, we must interpret it carefully.
A hospital that takes the sickest patients, the complicated multi-organ system failure cases combined with the advanced cancer cases most hospitals will transfer to that hospital, will simply have more of their patients die, raw, than a facility not doing such high-acuity work.
Statistical models of how sick the patients were can give us the estimated number of deaths for an average set of patients and the size of the patient population; this is the risk adjusted mortality.
Hidden within hospital mortality data, there can be a few patient subpopulations that are surviving at notably higher rates than the patients at a number of other hospitals.
Hidden survival is associated with higher than expected untimely deaths at some other hospitals. RAMR if noted and managed by those other hospitals can be an excellent tool for rapidly improving patient outcomes.
When researching a hospital for a complex procedure, ask specifically for their RAMR data in that specialty area. A hospital that’s uncomfortable providing it is telling you something.
2. Hospital-acquired infection rates
Hospital infections occur while a patient is in a hospital and were not present when they were admitted. This includes blood infections (CLABSI), urinary infections (CAUTI), surgical site infections, and infections caused by MRSA or _C. difficile_.
These are no coincidence. They directly relate to the cleanliness of the facilities, the training of the staff, the sterilization of the equipment, and the overall ethic toward infection control.
According to the World Health Organization (WHO), approximately 7 of every 100 patients in developed countries and 10 of every 100 patients in developing countries will acquire a healthcare-associated infection during their hospital stay. These numbers are way too high for something so preventable.
Low hospital infections risk is often one of the best gauges of hospital discipline.
You can have the fanciest gadgets and the best doctors, but if staff aren’t washing their hands, or catheters are not being inserted with clean protocols, infections will make your patients sicker.
When two hospitals match up in almost every other criterion, their patient infection rate is one of the few statistics that will differ.
Facilities will usually present their healthcare-associated infection data as a standardized infection ratio. If that number is regularly below 1.0, it’s better than the national average. If it’s regularly above 1.0, they have some explaining to do.
3. 30-day readmission rate
A readmission occurs when a patient who has been discharged from the hospital is admitted again within 30 days. Patients may be readmitted to the same hospital or to a different hospital depending on their health care needs.
The 30-day readmission rate is the percentage of patients who were discharged from the hospital and then readmitted within 30 days for the same condition, a related complication, or an unrelated problem.
High readmission rates may indicate that patients are at risk of medical complications or deterioration after they leave the hospital.
They may also be a signal that the care transition (i.e. the move from inpatient to outpatient care) is not optimal, and that patients are not getting the care they need after they leave the hospital.
A hospital with a low readmission rate has generally built real infrastructure around that transition – care coordinators, post-discharge phone calls, electronic health record access for outpatient providers, patient education that actually accounts for health literacy levels.
That infrastructure reflects a commitment to outcomes, not just the episode of care the hospital gets paid for.
This metric is particularly relevant for high-risk procedures and chronic disease management: cardiac surgery, joint replacement, heart failure, pneumonia. These are the areas where transitions of care carry the most clinical risk and where readmission data is most revealing.
4. Patient safety indicators and nurse-to-patient ratios
What are Patient Safety Indicators (PSIs)? They are a standardized set of clinical markers which identify potentially avoidable complications during a hospital stay.
Postoperative sepsis rates, postoperative pulmonary embolism, accidental punctures or lacerations during procedures, and iatrogenic complications are all examples of PSIs. They serve as a red flag for “this care shouldn’t go wrong if you’re doing it right according to the protocols.”
They matter because they identify process flaws which you wouldn’t find buried in the mortality stats. The patient who gets the postoperative clot and lives through it has still been injured. The PSIs count that.
Nurse-to-patient ratio is, by contrast, a structural measure. It influences those processes, however. The more patients a nurse has to care for, the less likely they are to have time to do it right.
In the intensive care unit, this is even more pronounced: lower nurse-to-patient ratios have been consistently linked in research to lower mortality, fewer medication errors, and quicker recognition of clinical deterioration. In a general medical or surgical ward, 1 nurse for every 5 or 6 patients is the typical ratio.
In an ICU, it’s roughly 1:1 or 1:2, with the variance due to patient acuity. A hospital that won’t fall below guidelines even with overflow populations or staff shortages is a hospital that’s demonstrating how seriously it takes the link between nurses’ workloads and patient outcomes.
When evaluating any hospital for a planned admission, ask whether they track and publicly report their PSI data, and ask what their average nurse-to-patient ratios are in the units you’d likely be treated in. Facilities that have ready answers are generally facilities with something worth reporting.
5. Patient experience and communication quality
The Hospital Consumer Assessment of Healthcare Providers and Systems survey is used to measure patient experience in several areas, including communication with doctors and nurses, staff responsiveness, pain management, discharge information, and overall hospital rating.
Patient experience has sometimes been written off as a satisfaction survey that has no bearing on clinical reality. This conclusion misrepresents the data.
Patients who report receiving very good or excellent communication from their doctors are more likely to report that they understood their diagnosis and that they understood how to manage their health after release.
They are also more likely to take medications as prescribed and follow up with outpatient medical care. These are not soft behavioral improvements.
They represent the difference between a readmission and an uneventful recovery, between appropriate continuing care and an unnecessary post-discharge complication.
High scores in the poorly understood “communication about medications” domain of the survey correlate with good self-management of the post-discharge medication regimen.
Poor scores in discharge information correlate with patients being overly cautious and returning to the emergency department when it is unnecessary.
These relationships are clear and consistent. HCAHPS data, when analyzed at the level of the patient-care domain rather than just as an overall score, offers a granular and actionable view of where the hospital machine is working and where it is breaking down.
Global accreditation and how it standardizes comparison
For a patient debating whether to pursue care at an international facility – elective surgery, specialized treatment, or healthcare travel of some kind – comparing hospitals across totally different national systems with no uniform reporting standards isn’t an easy thing to do.
That’s where global accreditation bodies come in. JCI (Joint Commission International) accreditation is the best-known international hospital quality seal.
JCI assesses hospitals against a standardized set of criteria around patient safety systems, medication management, infection control, staff qualifications, and outcomes reporting.
An accredited institution has been externally measured against the same yardstick used to assess the top hospitals globally, providing patients an apples-to-apples benchmark no matter where they are in the world.
Established international healthcare networks like acibadem maintain JCI accreditation to demonstrate that their standards have held up under independent external scrutiny — a meaningful consideration for patients weighing a trip halfway around the world.
JCI accreditation isn’t a guarantee of perfection, but it is a meaningful filter. It means the hospital has been measured against objective international safety benchmarks and met them – and that there’s an external accountability structure requiring them to maintain those standards over time.
How to actually find this data before you need it
Understanding the metrics that matter is only half the battle – it’s also necessary to know where to find them. Here’s how to get started:
For domestic hospitals, health-associated infection rates, readmission rates, and PSI safety data are kept by the national quality registries and published on government health transparency websites.
Most countries with public healthcare systems also maintain easily searchable hospital comparison tools. HCAHPS data can be trickier, but most often the original survey results are available for download directly through the national health reporting portal.
For international hospitals, you’ll want to check JCI accreditation status directly or ask the hospital’s international patient services office for the most recent RAMR data in the relevant specialty, the current HAI standardized infection ratios for both CLABSI and surgical site infections, and the most recent 30-day readmission rates for the specific procedure you’re considering.
Most of this should be easily available for accredited facilities. If a hospital either can’t or won’t produce it for you, that’s useful information in your decision-making process.
Before any major planned surgery, build a short checklist: JCI or equivalent accreditation status. RAMR in the relevant specialty.
HAI ratios for CLABSI and surgical site infections. 30-day readmission rate for the procedure. PSI tracking and public reporting. HCAHPS scores in doctor communication and discharge information.
This won’t make the decision for you. It will simply replace subjective rankings and glossy hospital marketing with the kind of objective clinical data that actually reflects what happens to patients once they’re in care. That’s the foundation the emotional side of your evaluation should start from.