
February 8th, 2021 | Updated on April 13th, 2021
For the data to be of any use, we should know how to visualize it to understand the story it portrays and even inform others.
Every day the data visualization tools continue to evolve, and they offer many features while working on accessibility and user-friendliness.
An increasing number of jobs nowadays require that we showcase data to support your decision making and therefore, visualization tools have become so crucial.
These days the visualization and dashboarding tools are cloud-specific to connect with data wherever they have stored it.
The key trends here are artificial intelligence, automation, and augmentation. That means that there will be a shift towards smart and efficient self-teaching applications performing the routine and tedious tasks at hand.
Though it is not necessary that every company would straight away dive into the world of AI, the change is imminent.
Gartner predicts that by the year 2025, most of our information will come from data-driven storytelling, and around 75% of the stories will come from automated systems.
The tools that we have listed are either visualization solutions in totality or analytics packages that are noticeable for visualization abilities. Here are some of the best tools in this category.
1. Tableau

Tableau is an integrated business intelligence (BI) and analytics solution that helps to analyze key business data and generate meaningful insights. The solution helps businesses to collect data from multiple source points such as SQL databases, spreadsheets, cloud apps like Google Analytics and Salesforce to create a collective dataset. Tableau’s live visual analytics and interactive dashboard allow slicing & dicing datasets for generating relevant insights and exploring new opportunities.
Review: PCMag
Tableau Desktop was one of the early players in the self-service business intelligence (BI) space. It’s this maturity that makes it one of our three Editors’ Choice winners for the category. New competitors, along with the rise of Big Data and Internet of Things (IoT), have put the pressure on Tableau to constantly improve over the years.
2. Cluvio

Cluvio is a cloud-based business intelligence and analytics solution that enables businesses to analyze data through a dashboard. The solution helps in running queries, filtering results, and displaying data via graphs and charts. Key features include a SQL editor, customizable R scripts, push notifications, dashboard sharing with clients and more. The Cluvio dashboard can also be shared with the colleagues through a link which enables users to access it without logging in. Users to slice and dice data, specify date ranges and configure aggregation settings.
Review: Financesonline
Consequently, Cluvio has taken inspiration from the toughest security measures seen among banking institutions. The result is security that equals or exceeds some of the most robust protocols around along with the physical insurance provided by vigilant auditing and monitoring of anything that is crucial to the integrity of your data.
3. Zegami

Zegami is a data visualization solution that combines cutting edge tools like machine learning to help businesses and research organizations gain insights by exploring large datasets. With Zegami, you can visualize and analyze unstructured data such as images and video. It enables you to examine large image datasets simultaneously on a screen and spot patterns or anomalies. Data scientists using the solution can train their machine learning models. Cancer Research UK aims to develop a cancer detection system using Zegami, highlighting cancerous lesions on the video as the patient is being examined in real-time.
Review : Getapp
The overall experience with Zegami has been great! I really like using the software and it helps spots trends in my data much quicker than in any other way. I think is very visually pleasing and easy to use.
4. Reveal

Reveal, formerly ReportPlus, is a self-service business intelligence and analytics solution designed for midsize and large enterprises. It allows anyone to analyze sorted and unsorted databases, set and view performance metrics, explore trends, and share rich data visualizations and dashboards. It is available in both on-premise and cloud-based deployment models and also offers native apps for iOS, Windows and Android devices.
Reveal allows users to connect to various databases, including online sources like cloud storage drives, social media platforms, SaaS applications as well as offline sources like Excel, SQL database and more.
Review: Capterra
Being so flexible, I had no friction to start adding reports and to check them periodically. If I had to make changes to my Server/API instead, I probably wouldn’t have even half of the reports I currently have.
5. Answerdock

Answerdock is a cloud-based business intelligence solution for organizations of all sizes across industries such as retail, healthcare, finance, communication and media. Key features include scheduled data loads, search-based analytics, user management, data mining and automatic chart selection. The time series analysis tool allows users to plot metrics over time on a monthly or yearly basis. Data filters can be used to view data from specific timeframes or geographies.
Review: Capterra
We just like the ease of use and the speed we are using it to track our revenue , clicks , search performance , we have connected to at least 15 datasets, and are able to search through them quickly and intuitively. We also have setup the typical dashboards just like on other software and have then scheduled on monthly and weekly basis, but the main thing we like is the search- like interface .
6. Cumul.io
Cumul.io is a dashboard creation tool that helps businesses design personalized dashboards with custom logos, colours and login screen to establish brand identity with clients, visualize data and generate reports. The platform enables organizations to drag-and-drop various spreadsheets formats including excel, GeoJSON, TSV, CSV, TopoJSON, and more.
Review: G2
Cumul makes it easy to create and manage dashboards. But the real value they create is when you start embedding cumul in your own software. Imagine cumul as the google tag manager of charts, business data and insights.
7. Domo

Domo is the Business Cloud, empowering organizations of all sizes with BI leverage at cloud scale in record time. With Domo, BI-critical processes that took weeks, months or more can now be done on the fly, in minutes or seconds, at unbelievable scale, helping teams and organizations go fast, go big and go bold.
Review: Softwareadvice
We were originally looking for dashboard software. Something like Geckoboard, but we wanted something more advanced. We were using multiple tools, and wanted to collect data from them. We then found Domo. Within days we had integrated our CRM database, Website Analytics, Invoicing database, and Order Processing database.
8. Sisense
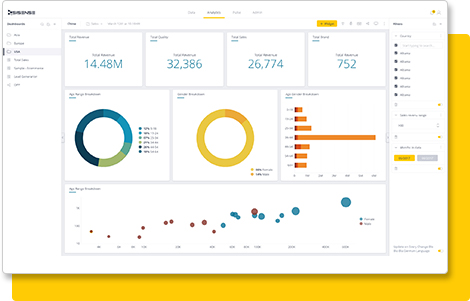
Sisense is an agile business intelligence (BI) solution that provides advanced tools to manage and support business data with analytics, visuals and reporting. The solution allows businesses to analyze big and disparate datasets and generate relevant business trends for them. Sisense allows businesses to combine data from many disparate sources and club them into a single database. Once done, the solution itself rearranges data into a predefined standard format.
Review: Trustradius
As a Business Intelligence professional, I live to learned about new solutions to create opportunities in different sized organizations. We implemented Sisense in order to help visualize data across different organizations. As of now the tool is used to display performance indicators and to help develop and maintain the performance-based budget.
9. Dundas BI Software

Dundas BI, from Dundas Data Visualization, is a browser-based business intelligence and data visualization platformthat includes integrated dashboards, reporting tools, and data analytics. It provides end users the ability to create interactive, customizable dashboards, build their own reports, run ad-hoc queries and analyze and drill-down into their data and performance metrics.
Review: Capterra
We needed a self-service BI solution that would cover manufacturing operations dashboards and use cases. We wanted a tool that would allow for the distribution of centralized common dashboards but also allow for self-service customization. It needed to connect to multiple disparate data sources, and provide native ETL. It also needed to allow for real-time refresh capability.
10. Style Intelligence
InetSoft Style Intelligence is a business intelligence software platform that allows users to create dashboards, visual analyses and reports via a data mashup engine—a tool that integrates data in real time from multiple sources. These sources can include OLAP servers, ERP apps Web services, relational databases and spreadsheets.
Review: G2
The flexibility of the system is very robust. The ability to connect to disparate data sources and “mash them up” into a single dashboard or report makes this our go-to for data analysis.
11. Sigma

Sigma is the business intelligence and analytics solution that allows everyone in your organization, not just analysts, to ask questions and find answers using data. Instant, guided access to the cloud data warehouse enables teams to quickly conduct ad-hoc exploration without extracting data or updating models. A familiar spreadsheet interface and formulas empower business experts to independently uncover insights and make data-driven decisions with no code required, freeing data teams to focus on more strategic and impactful work.
Review: Softwareadvice
You can easily add data sources, and then create datasets with the columns you need – It also lets you format the columns and process the data by using formulas, very similar to what you would do in a spreadsheet, but more streamlined – You can easily join different datasets and filter data.
12. Looker

Looker is a cloud-based business intelligence (BI) platform designed to explore and analyze data. The solution helps businesses to capture and analyze data from multiple sources and make data-driven decisions. Looker provides business teams the ability to analyze supply chains, market digitally, quantify customer value, interpret customer behavior, and evaluate distribution processes. Users can also “view source” to understand how the data they are viewing is being manipulated.
Review: Trustradius
Looker is used by many departments in our organization as a hub for business intelligence data. We are all able to access data dashboards in a smooth and slick UI for various uses, including sales, marketing, and research. It’s a great way for stakeholders across the organization to view customized
13. AnswerRocket

AnswerRocket is a search engine-based analytics and data visualization solution used by companies to receive complex analysis results in charts and graphs. The solution has a speech-to-text feature in which users can speak a query and the solution will provide relevant data with insights. It also provides data storage both in the cloud as well as on-premise.
Review: Capterra
I’ve been using AnswerRocket for 6 months and I’ve had a positive experience.Good layout and structure – making it easy to navigate. Allows our users to ask intuitive questions of our data Intutive for end users to learn Easy implementation Great data visualizations — allows us to change or customize easily Connects to all our critical data sources
14. Toucan Toco
Toucan Toco is a cloud-based data visualization solution designed to deliver data and insights to non-technical decision makers using visual data storytelling. With Toucan’s application studio, businesses are able to create and display customizable BI applications and deploy these applications to different devices using Toucan’s adaptive design. Key features include an application design studio with different deployment options, in-depth and embedded analytics, and 100+ pre-built data connectors.
Review: Capterra
The screens and the design are so beautiful ! the team understand very quickly and easily our needs and proposed relevant data organization and design. the secured access with the connexion of our internal SSO
15. BOARD

Created to combine business intelligence, corporate performance management, and business analytics, BOARD is a full-featured business intelligence system that serves midsize and enterprise-level companies in a variety of different industry segments. Within the reporting functionality, BOARD allows users to pull from almost any data source, as well as generate full self-service reporting.
Review: G2
Board is a completely unique platform that allows its users to: plan, forecast and perform advanced analysis in the most efficient way available, personally I consider that all the functionality provided by Board is completely unified and shares the same metrics, data and vision of customers, products or services and marketing.


